We think about data science interview questions A LOT. QuantHub’s data science skills assessment platform is implemented in a number of ways during the data scientist interview process and for different levels of data science hires.
One thing we know is that the data science space moves quickly, as do the skills and talent required to keep up. So we’re always updating and evolving our data science interview questions, skills assessment and testing methods.
Data Scientists need to know a lot! Data literacy is a must. After all, data science covers several fields. While it’s impossible to create a full list of the hundreds of potential data science interview questions some types of questions remain part and parcel of data science interviews. We put together a list of common data science interview questions that hiring managers can incorporate and for which candidates can prepare. They may seem a bit random, and the truth is, they are to a certain extent. But that’s what you could expect from any data science interview or even from QuantHub’s skills assessments.
Basic Data Science Interview Questions

Here’s a sampling of the kinds of basic data science interview questions and data-related topics you might cover in a data science interview.
WHAT ARE SOME BASIC BIG DATA ARCHITECTURE COMPONENTS?
Some of the basic components of big data architecture include sources of data, data storage, batch processing and more. Data sources include application data stores such as relational databases, real-time data and weblog files. Data storage is often in the form of distributed file stores called a data lake. Batch processing involves using long-running batch jobs to filter, aggregate and prepare large amounts of data for analysis. Another basic component is real-time message ingestion which captures and stores real-time messages for stream processing acting as a buffer. Stream processing filters aggregate and prepare streamed data for analysis. Finally, analytical data storage prepares data for analysis and provides it in a structured format that can be queried using analytical tools.
WHAT IS THE DIFFERENCE BETWEEN STRUCTURED AND UNSTRUCTURED DATA?
Structured data is highly-organized and formatted in a way so it’s easily searchable in relational databases. Unstructured data has no pre-defined format or organization, making it much more difficult to collect, process, and analyze.
WHAT IS CACHING AND WHY DO YOU USE IT IN DATA SCIENCE?
Caching enables content to be retrieved faster because an entire network round trip is not necessary. Caching can be necessary to save various data files when the process of loading and/or manipulating data takes a considerable amount of time. There will be caching on the server where already computed elements may not need to be recomputed. When you want to access some data that takes a lot of time and resources to look up, you cache it so that the next time you want to look up that same data, the process of doing so is more efficient.
WHAT IS BIAS AND WHAT TYPES OF BIAS CAN OCCUR DURING SAMPLING?
Bias is the difference between the average prediction of a model and the correct value that you are trying to predict. A model with high bias pays very little attention to the training data and oversimplifies the model. It always leads to high error on training data.
The three types of bias that can occur are selection, under coverage and survivorship bias.
WHAT ARE SOME CORE STEPS TO TAKE FOR DATA PREPROCESSING?
Data preprocessing involves giving structure to the data for better understanding and decision making related to the data. Some key steps in data pre-processing includes:
- Data discovery and acquisition: Gathering data from available sources and trying to understand and make sense of it.
- Data structuring and transformation: Taking different data set formats and sizes and giving it a consistent size and shape when merged together.
- Data cleaning: Imputing null values and treating outliers/anomalies in the data to make it usable for further analysis.
- Exploratory Data Analysis: Finding patterns in the dataset and extracting new features from the given data in order to optimize the performance of a model.
- Validating: Verifying data consistency and quality.
- Publishing/Modeling: Processing the data further with an algorithm or machine learning model.
WHAT ARE THE FEATURE SELECTION METHODS TO SELECT THE RIGHT VARIABLES?
There are two types of methods:
- Filter methods include linear discriminant analysis, ANOVA and Chi-square (most commonly used). These methods are meant to pull the bad data out.
- Wrapper Methods include forward selection, backward selection and recursive feature elimination.
Want to Prepare for Data Science Interview Questions?
Showcase Your Data Science Knowledge Using QuantHub.
You are given a dataset consisting of variables having more than 30% missing values. How will you deal with this?
If the data set is huge, you can remove the rows that have missing data values. This is the quickest way to deal with this. If the dataset is small, you can substitute missing values with the mean of the rest of the data using pandas dataframe in python i.e. df.mean()dr.fillna(mean).
For given points, how will you calculate the Euclidian Distance in Python? Given points : plot1 = [1,3} plot2 = [2,5]
euclidean_distance = sqrt( (plot1[0]-plot2[0])**2 + (plot1[1]-plot2[1])**2 )
How would you maintain a deployed model?
There are four essential steps:
- Monitor to determine the performance accuracy of the model
- Calculate evaluation metrics of the current model to determine if a new algorithm is needed
- Compare the two models to determine which model performs the best
- Rebuild the best performing model using the current state of data.
What are recommender systems?
A recommender system is a system that predicts the rating or preference that a user would give to a product (or other choice). There are two different types of recommender systems: collaborative filtering and content-based filtering. Collaborative makes recommendations based on other users with similar interests. Content-based filtering uses the properties of the product to recommend products with similar properties.
Data Science Statistics Interview Questions
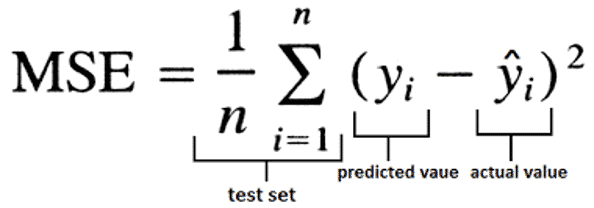
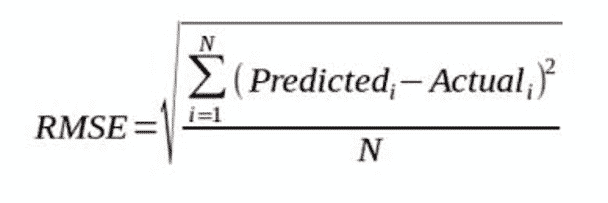
 What is RMSE and MSE in linear regression models?
 What is RMSE and MSE in linear regression models?
RMSE stands for root mean square error and MSE stands for mean square error. They are the most common measures of accuracy for a linear regression model. The formulas are below.
What is selection bias and what are the different types?
Selection bias is a kind of error that occurs when a model builder decides what data is going to be used in a way that doesn’t allow for randomization. It is the distortion of statistical analysis accuracy resulting from the non-randomized method of collecting samples.
Types of selection bias include:
- Sampling bias, which is an error due to a non-random sample of a population causing some members of the population to be less likely to be included than others resulting in a biased sample.
- Time interval bias, which means a trial may be terminated early at an extreme value, but the extreme value is likely to be reached by the variable with the largest variance, even if all variables have a similar mean.
- Data bias, which occurs when specific subsets of data are chosen to support a conclusion or rejection of bad data on arbitrary grounds.
- Attrition bias is caused by a loss of participants discounting trial subjects/tests that did not run to completion. It is closely related to survivorship bias, where the only subjects that survive a process are included in the analysis.
What is overfitting and how can you avoid overfitting of your model?
Overfitting a model is a condition where a model begins to describe the random error in the data rather than the relationships between variables. It reduces the model’s usefulness outside the original dataset. This problem occurs when the model is too complex.
There are 3 main ways to avoid overfitting a model:
1. Keep the model simply by taking into account fewer variables, which reduces some of the noise in the training data.
2. Use cross-validation techniques such as k-folds.
3. Use regularization techniques such as LASSO that penalize certain model parameters if they are likely to cause overfitting.
What criteria would you use to select a representative sample?
3 key criteria are diversity, consistency, and transparency. The sample must be as diverse as the data set. Any changes observed in the sample data should also be reflected in the true population. A discussion should be had within the analytics team to decide the appropriate sample size and structure that is a true representative of the full data set.
What is the difference between univariate, bivariate and multi-variate analysis?
The difference is in the number of variables used. Univariate uses 1 variable. Its purpose is to describe the data and find patterns in it. Bivariate analysis uses two variables. Its purpose is to find a relationship between the two variables. Multi-variate analysis uses more than two variables. Its purpose is to
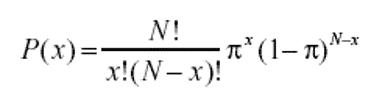
What is the binomial probability formula?
What is A/B testing?
An AB test is a statistical hypothesis testing process whereby a hypothesis is made about the relationship between two data sets and those data sets are then compared against each other to determine if there is a statistically significant relationship or not. A prediction is made that dataset B will perform better than dataset A. Then both data sets are observed and compared to determine if B is a statistically significant improvement over A.
DESCRIBE THE DIFFERENCE BETWEEN COVARIANCE AND CORRELATION.
Covariance gives the direction of a linear relationship while correlation gives both strength and direction.
Want to Prepare for Data Science Interview Questions?
Showcase Your Data Science Knowledge Using QuantHub.
Why Is Re-sampling done?
Resampling is done in any of these cases:
- Estimating the accuracy of sample statistics by using subsets of accessible data or drawing randomly with replacement from a set of data points
- Substituting labels on data points when performing significance tests
- Validating models by using random subsets (bootstrapping, cross-validation)
What is a p-value and what is it used for?
The p-value is the probability of obtaining results as extreme as the observed results of a statistical hypothesis test, assuming that the null hypothesis is correct. When you perform a hypothesis test in statistics, a p-value can help you determine the strength of your results. The claim which is on trial is called the Null Hypothesis.
p-value is a number between 0 and 1. A p-value ≤ 0.05 indicates strength against the null hypothesis which means you can reject the null hypothesis. It means your data are unlikely with a true null. A high p-value ≥ 0.05 indicates strength for the null hypothesis which means we can accept the null hypothesis. It means your data are likely with a true null. A p-value of 0.05 indicates the hypothesis could go either way.
A couple has two children, at least one of which is a girl. What is the probability that they have two girls?
There are 4 equally likely possibilities : BB, BG, GB and GG; where B = Boy and G = Girl and the first letter denotes the first child.
You can exclude the first case of BB. Thus from the remaining 3 possibilities of BG, GB & GG, you find the probability of the case with two girls. The probability of having 2 girls, given one girl is 1/3.
Machine Learning Interview Questions
 What is Logistics Regression?
 What is Logistics Regression?
It is a process that measures the difference between a dependent variable (what you want to predict) and one or more independent variables (features) by estimating the probabilities using its underlying logistics function (i.e. sigmoid). This technique used to predict a binary outcome that is either zero or one, or a yes or no.
The two types of logistics regression are binary and multinomial. Binary deals with two categories whereas multinomial deals with three or more categories.
If a model established by your team gives 95% accuracy, how will you know if it’s correct or not?
The best that you can do is to compare the performance of machine learning models on specific data to other models also trained on the same data. Machine learning model performance is relative. Your ideas of what score a good model can achieve only make sense and can only be interpreted in the context of the skill scores of other models also trained on the same data.
To do this you should develop a baseline model to provide the point from which the skill of all other models trained on a data set can be evaluated. If the model achieves performance below the baseline something is wrong. True model performance will fall within the range of the baseline and 100%.
What is a random forest model and how do you build a random forest model?
A random forest is a buildup of a number of decision trees. The steps to building one are :
1. Randomly select “k” features from total “m” features where K
What is the bias-variance trade-off and why is it important?
The goal of any supervised machine learning algorithm is to have low bias and low variance. Increasing bias will decrease the variance and vice versa. So the k-nearest neighbors algorithm has low bias and high variance. However, you can increase the value of k to increase the number of neighbors that contribute to the prediction and in turn increases the bias of the model.
The tradeoff between bias and variance is in the model complexity. If a model is too simple and has very few parameters then it may have high bias and low variance. On the other hand if a model has a large number of parameters then it’s going to have high variance and low bias.
You need to find the right/good balance without overfitting and underfitting the data. So it’s important to understand the bias-variance trade-off in order to avoid over or underfitting a model.
What is the difference between supervised and unsupervised learning?
The differences between these two types of learning are in data labeling, feedback mechanisms and algorithms used. Unsupervised learning has no labelled data inputs and no feedback mechanism. Supervised learning most commonly uses decision tree, logistic regression and support vector machine algorithms. Unsupervised learning uses k-means clustering, hierarchical clustering, and apriori algorithms.
What are the steps to making a decision tree?
- Take the entire data set as input
- Calculate entropy (measure of chaos of inputs) of your target value as well as predictor attributes.
- Calculate the information gain of all attributes.
- Choose the attribute with the highest information gain as the root node.
- Repeat the same process on every branch until the decision node of each branch is finalized.
Another way to ask this question would be to ask for example, how you would build a decision tree to decide whether or not to accept a job offer. Clearly for this answer you must know how to calculate entropy and information gain.
Name 5 classification algorithms.
Common classification algorithms are:
- Linear Classifiers – Logistic regression. Naive Bayes classifier. Fisher’s linear discriminant.
- Quadratic
- Neural networks – Recurrent and modular
- Kernel Estimation – k nearest neighbor
- Decision Trees – random forests
- SVM – Linear and non-linear, least squares
How do you split your data between training and non-training?
Training and validation sets from data can be split on 2 principles. First, ensure the validation set is large enough to yield statistically meaningful results. Second, the validation set should be representative of the data set as a whole. In other words, don’t pick a validation set with different characteristics than the training set. An optimal way to split data would be to use k-folds validation. This method makes multiple splits of the dataset into training and validation sets. This method offer various samples of data and ultimately reduces the chances of overfitting.
Data Analysis Interview Questions
 What are the core steps in the data analysis process?
 What are the core steps in the data analysis process?
Data analysis involves inspecting, cleansing, transforming and modeling data to get it ready to provide insights and support decision-making. Some of the key steps involved are:
- Goal setting: The business unit must decide on objectives for the data science team and set clear goals to steer the team. The objectives defined in this step will be vital for the next steps.
- Gathering data: Data gathering is the process of gathering information on required variables. The emphasis is on ensuring accurate and honest collection of data. Data is collected from various sources.
- Data processing: This step requires organizing and structuring data in proper format to simplify the approach cleaning and analysis. It also involves encoding and standardizing variables for better interpretation.
- Data cleaning: This is the process where you’ll find, change or remove any incorrect or redundant data. It includes correcting spelling mistakes, handling missing data and weeding out nonsense information.
- Data analysis: Various data analysis techniques can be used to understand, interpret, and derive conclusions based on business requirements. In this step you can explore the data, find co-relation amongst features and identify the relevance of each feature to the problem.
- Results interpretation: Once the data has been sorted and analyzed, it can be interpreted. It is important to know if the data answers your original question and helps in defending against any objections. For these steps, we can use machine learning algorithms as well as descriptive and inferential statistics.
- Communication of results: This is the last step of this process and can be called storytelling. Here you try to communicate this to other teams & management using visualization tools.
How can you inspect missing data?
Some techniques that can be used to handle missing data are:
- Imputation of missing values depending on whether the data is numerical or categorical.
- Replacing values with mean, median, mode.
- Using the average value of K nearest neighbors as an imputation estimate.
- Using linear regression to predict values.
How does data cleaning play a vital role in analytics?
Cleaning data from multiple sources helps to transform it into a format that a user can work with. It helps to increase the accuracy of machine learning models and builds confidence in business insights generated from the analysis. Data cleaning is a cumbersome process because as the number of data sources increases, the time taken to clean the data increases exponentially due to the number of sources and the volume of data generated by these sources.
List several tools that are useful in data analysis.
Some to include and be able to talk about:
- Tableau
- RapidMiner
- OpenRefine
- Google Search Operators
- Solver
- NodeXL
- Io
- Google Fusion Tables
What is the difference between data mining and data profiling?
The difference between data mining and data profiling are:
Data profiling is the process of assessing the data values in a given dataset for uniqueness, consistency and logic. It targets the instance analysis of individual attributes. It gives information on various attributes like value range, discrete value and their frequency, the occurrence of null values, data type, length, etc. Data profiling cannot identify any incorrect or inaccurate data but can detect only business rules violations or anomalies. The main purpose of data profiling is to find out if the existing data can be used for various other purposes.
Data mining refers to the analysis of datasets to find relationships that have not been discovered earlier. It focuses on cluster analysis, detection of unusual records, dependencies, sequence discovery, relation holding between several attributes, etc.
What are some common problems that data analysts encounter during analysis?
- Having a poor formatted data file. For instance, having CSV data with un-escaped newlines and commas in columns.
- Having inconsistent and incomplete data.
- Misspelling and duplicate entries
- Having different value representations and misclassified data.
What data validation methods can be used by an analyst?
Data screening and data verification. They are defined as follows:
Data Screening – Various algorithms are used to screen the entire data to find any erroneous or questionable values. Such values need to be examined and should be handled.
Data Verification– Each suspect value is evaluated on case by case basis and a decision is to be made if the values have to be accepted as valid or if the values have to be rejected as invalid or if they have to be replaced with some redundant values.
What is an outlier?
The outlier is a commonly used terms by analysts referred for a value that appears far away and diverges from an overall pattern in a sample. There are two types of Outliers
- Univariate
- Multivariate
Data Science Coding Interview Questions
 What are the data types used in Python?
 What are the data types used in Python?
Number (float, integer), string, tuple, list, set, dictionary. The first three data types cannot be modified during run time. The last three can.
What is a Python dictionary?
A dictionary is one of the built-in data types in Python. It defines an unordered mapping of unique keys to values. Dictionaries are indexed by keys, and the values can be any valid Python data type (even a user-defined class). Notably, dictionaries are mutable, which means they can be modified. A dictionary is created with curly braces and indexed using the square bracket notation.
In the following example what will be the output?
Text = “I love data science”
Print (text [-3])
The answer is: n. You must understand negative index in Python to answer this question.
Write Python code to create…(can be anything)
Create an employees DataFrame from the “HR.csv” file. Use the read_csv() function from the pandas library.
The code would be:
import pandas as pd
employees = pd.read_csv(‘HR.csv’)
Briefly explain the different data structures in R.
- Vector – a sequence of data elements of the same type.
- List – R objects which contain elements of different types such as numbers, strings, vectors, or another list inside it.
- Matrix – a two-dimensional data structure used to bind vectors from the same length. All elements in a matrix must be of the same type.
- Dataframe – combines features of matrices and lists, i.e. different columns can have different data types.
What packages are used for data mining in R?
- data.table- provides fast reading of large files
- rpart and caret- for machine learning models.
- Arules- for association rule learning.
- GGplot- provides various data visualization plots
- tm- to perform text mining.
- Forecast- provides functions for time series analysis
What Python IDEs are the most popular in data science?
- PyCharm is specifically used for Python programming. It has integrated tools for unit testing, code inspection, version control, refactoring, and navigation. It also has support for libraries like scikit-learn, matplotlib, NumPy, and pandas. It provides the ability to plot, manage, and explore graphs in real-time. It also supports database languages like SQL (via plugins).
- Rodeo is a Python IDE mainly for data science and machine learning projects. This IDE helps you explore and interact with data and plots.
- Spyder is a free open-source Python IDE. The name stands for Scientific PYthon Development EnviRonment. Spyder is distributed with Anaconda. Spyder has integrated IPython console, profiler, debugger, documentation viewer, variable explorer, and more. It is known for being the best in class variable explorer in Python.
- Jupyter Notebook is arguably the best for data science. It is an open sourced web-based environment that supports data cleaning, data transformation, numerical simulation, statistical modeling, data visualization and machine learning. Jupyter contains in-built libraries like Pandas, NumPy, etc. to help coders better process data. It is known for its ease of use and informative references.
- Atom is another free, open-source, and general-purpose IDE, i.e. code editor. Atom is mature and has a wide and dedicated community. Atom also has integrated GIT and GitHub support.
- Visual Studio Code was developed by Microsoft to provide cross-platform Python support to coders. It is entirely free and open-source. Visual Studio Code is highly customizable and has a rich set of extensions that can be used to improve the available functionalities. Coders can also work with GIT from Visual Studio code.
What is Pandas?
Pandas is a Python open-source library that provides high-performance and flexible data structures and data analysis tools that make working with relational or labeled data easy and intuitive.
Name some functions available in “dplyr” package.
Functions in dplyr package are:
- filter() to select cases based on their values.
- arrange() to reorder the cases.
- select() and rename() to select variables based on their names.
- mutate() and transmute() to add new variables that are functions of existing variables.
What is this query about?
SELECT
emp_no, AVG(salary)
FROM
salaries
GROUP BY emp_no
HAVING AVG(salary) > 120000
ORDER BY emp_no;
This query is about extracting the average salary obtained by employees only when the salary value is larger than $120,000.
What is an SQL View?
Am SQL view is a virtual table whose contents are obtained from an existing “base table” (or tables). The retrieval happens through an SQL statement incorporated into the view. So, a view object is a view into the base table. The view itself does not contain any real data because the data is electronically stored in the base table. The view simply shows the data contained in the base table.