📊🤔🔍
Hey, friends! Today, we’re talking about overplotting. 📈
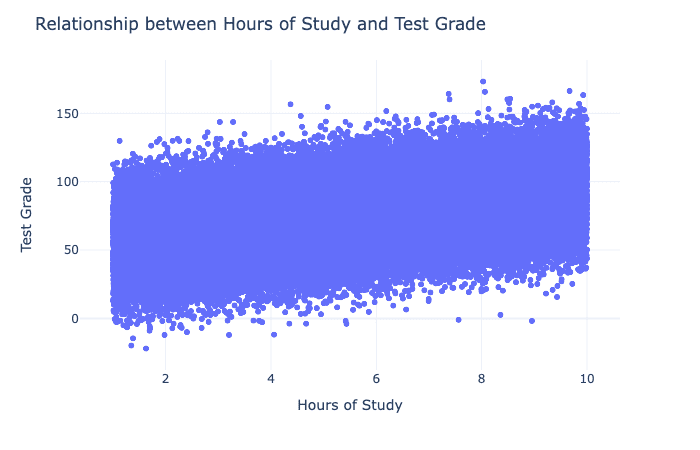
Overplotting occurs when there are too many data points in a scatterplot, and the points overlap, making it difficult to see the overall pattern in the data. To address this issue, you can use several techniques, including adding transparency to the points, sampling the data, or using a hexagonal bin plot. Adding transparency to the points can help you see where there are areas of high density, while sampling the data can help you reduce the number of points in the plot. 🔍
For example, let’s say you’re looking at a scatterplot that shows the relationship between the number of hours of study and the grade on a math test. If there are too many data points in the plot, you could add transparency to the points or sample the data to make it easier to see the overall pattern. 📊
![]()
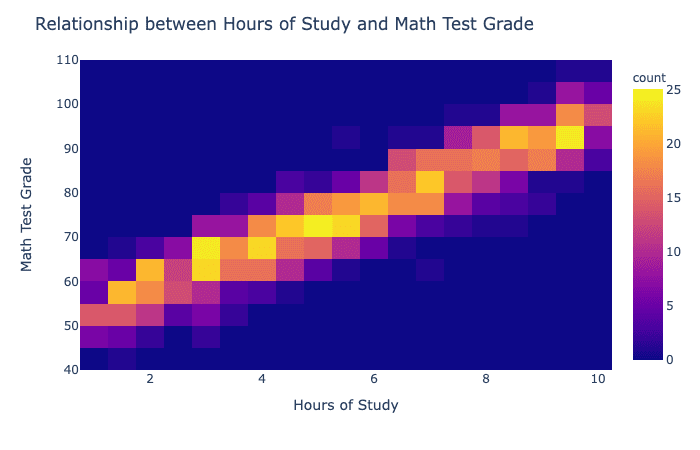
A hexagonal bin plot is best used when there are too many data points to display in a scatterplot, and overplotting is an issue. The plot divides the data into hexagons and colors the hexagons based on the number of data points in each hexagon. This creates a two-dimensional histogram and helps to visualize the overall pattern in the data. 📈
For example, let’s say you’re looking at a hexagonal bin plot that shows the relationship between the number of hours of study and the grade on a math test. The plot divides the data into hexagons and colors the hexagons based on the number of data points in each hexagon. This can help you see the overall pattern in the data when overplotting is an issue. 📊
So there you have it, friends! To address overplotting in scatterplots, you can add transparency to the points, sample the data, or use a hexagonal bin plot. 🤓📊🔍