Hey, friends! Today, we’re talking about ways to explore bivariate data and the characteristics we typically look for when exploring relationships between variables. 📈
Common Ways to Explore Bivariate Data
Two common ways to explore bivariate data are correlation coefficients and scatterplots.
A correlation coefficient is a statistical measure of the strength and direction of the relationship between two variables.
A scatterplot is a graph that shows the relationship between two variables. 🔍
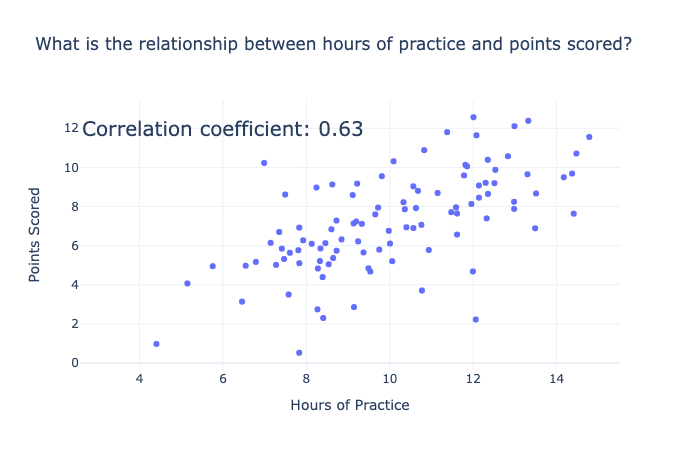
For example, let’s say you’re exploring the relationship between the number of hours of practice and the number of points scored in basketball games. You could calculate the correlation coefficient to see if there’s a relationship between the two variables. You could also create a scatterplot to visually explore the relationship. 🏀📈
What Are Data Characteristics That We Typically Look for When Exploring Relationships Between Variables?
There are three common data characteristics that we typically look for when exploring relationships between variables: associations, clusters, and gaps.
- Associations refer to the strength and direction of the relationship between two variables.
- Clusters refer to groups or patterns of data points that are close together.
- Gaps refer to areas of the graph where there are few or no data points. 🔍
For example, let’s say you’re exploring the relationship between the number of hours of practice and the number of points scored in basketball games using a scatterplot. You could look for associations between the two variables by looking at the trend of the data points. You could also look for clusters of data points that are close together and gaps where there are few or no data points. 🏀📊
So there you have it, friends! When exploring bivariate data, common ways to explore are correlation coefficients and scatterplots. And when exploring relationships between variables, we typically look for associations, clusters, and gaps in the data. 📈🔍🤓