Hey, guys! Today, we’re discussing frequency contingency tables and how they can help you explore relationships between two variables. 📈
When is it Most Helpful to Use a Frequency Contingency Table?
Contingency Table: Favorite Sport by Favorite Music Genre
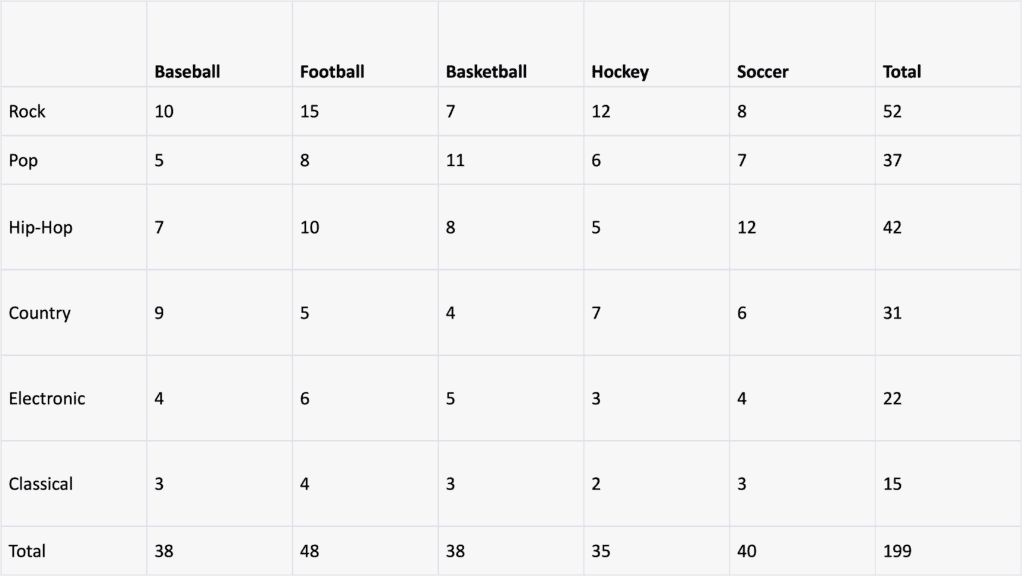
Well, frequency contingency tables are great when you want to explore the distribution of values for two variables and possible relationships between them. 🔍 For example, you could use a frequency contingency table to see how the type of music someone listens to is related to their favorite sport. 🎵🏀
What Do Marginal Distributions Show in a Contingency Table?
Marginal distributions show the frequency tabulation for each variable. They show the total counts or percentages across columns or rows. 📊
- For example, if you were looking at the relationship between favorite sports teams and the type of music, the marginal distribution for sports would show the total number of people who liked each sport. 🏀🏈🎾
What Exactly Are Marginals in a Contingency Table?
Marginals are the counts or percentages across columns or rows in a contingency table. They give you a sense of the overall distribution of values for each variable. 🔍
- For example, in a contingency table that shows the relationship between favorite sports and type of music, the marginals would show the total number of people who liked each sport and the total number of people who liked each type of music. 📈
How Do You Calculate Conditional Percentages in a Contingency Table?
To calculate conditional percentages in a contingency table, you divide the frequency for a specific cell by the total frequency for that row or column. 🔢 This gives you the percentage of people who fall into that category, given that they fall into the row or column.
- For example, you could calculate the percentage of people who listen to hip-hop music and also like football by dividing the frequency for that cell by the total frequency for the “hip-hop” row. 🎵🏀
So there you have it, guys! Frequency contingency tables are a great tool for exploring relationships between two variables. Marginal distributions show the frequency tabulation for each variable, and marginals are the counts or percentages across columns or rows. And to calculate conditional percentages, you divide the frequency for a specific cell by the total frequency for that row or column. 📊🔍🤓