The martini glass visual narrative structure allows you to transition from an author-driven to a reader-driven narrative and encourages audience exploration.
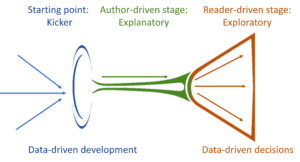
The martini glass structure begins with a narrow and focused narrative path, which can be compared to the stem of a martini glass. This early stage is author-driven, meaning we guide our audience through the story we want to present. It introduces and establishes the framework for the data and main ideas.
- For example, imagine we’re telling the story of a business’s sales growth. We might start with a line chart showing the increase in revenue over the past five years. This presents a simple yet powerful opening connected to our main narrative.
Once we’ve built the foundation of our story in the stem stage, we can move to the body of the martini glass—the broader part of the glass that represents reader-driven exploration. Here, we provide various data points, visuals, and interactive components that allow our audience to explore the story more deeply and from different angles.
- Continuing with our business sales growth example, we could present a collection of interactive dashboards, charts, and tables displaying data on product performance, regional sales, and customer demographics in the body of the martini glass. This way, our audience can engage with the data, form their perspectives, and become more immersed in the narrative.
To smooth the transition between the stem and body stages, ensure a clear moment when the focus shifts from author-driven storytelling to reader-driven exploration. One approach to achieve this is by using explicit call-to-action statements, like “Now, let’s explore various aspects of the business’s sales growth and its drivers.”
In summary, the martini glass visual narrative structure effectively combines the power of author-driven storytelling with the engagement and flexibility of reader-driven exploration. Starting with a focused narrative and gradually transitioning to an exploratory mode allows us to create highly effective data visuals and data stories that captivate and inform our audience.