In any interactive visual narrative, it’s crucial to highlight the meta-story because it provides the broader context and framework within which your data and visualizations become meaningful. The meta-story relates to the bigger picture and the overarching insights we can gain from the data that is being presented. By focusing on the meta-story, you help the audience understand the specific data points you’re showing, why it matters, and how it fits within a greater narrative.
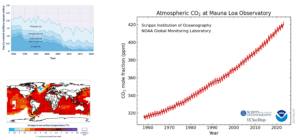
For example, imagine a scenario where you’re viewing a series of charts and graphs on global warming. Each chart tells a specific story, such as rising CO2 levels, increasing ocean temperatures, or melting ice caps. Individually, these visualizations are important, but it may be challenging for the audience to grasp the overall implications of these data points. The meta-story here would be the broader impact of global warming on our planet and its ecosystems.
By calling out the meta-story, you ensure that your audience can make connections between the individual data points and the broader context. This helps them develop a more coherent and holistic understanding of the subject matter, ultimately making your visual narrative more effective and engaging. Here’s a helpful approach to adequately call out the meta-story in a visual narrative:
Define the context
Before diving into the individual visualizations, provide a high-level overview of the subject matter to help anchor the audience in the topic. For the global warming example, you could start with general information about climate change, its causes, and its effects on the planet.
Connect the data
As you present each data visualization, explicitly link it back to the meta-story. Explain how each data point or visualization connects to the broader narrative of global warming, helping the audience understand its relevance and importance.
Highlight trends and patterns
While presenting the data visualizations, call out the trends and patterns emerging from the data. For example, emphasize the increase in CO2 levels over time or the correlation between rising temperatures and shrinking ice caps. By doing this, you’re helping the audience see the bigger picture and reinforcing the meta-story.
Summarize the narrative
Conclude your presentation by returning the various elements to the meta-story. Reiterate the key insights and their implications for the broader context, reinforcing the importance of the overarching narrative you’ve been telling.
Calling out the meta-story in your interactive visual narrative ensures that your visual narrative is not just a collection of disjointed data points but an engaging story that resonates with your audience and reveals crucial insights.