Hey there! It’s Chip, and today, we’re going to talk about outliers! 📊
👀 What are outliers? Outliers are data values that are very different from most of the other data values in a distribution. They can occur due to errors in data collection, measurement, or recording, or they can be caused by unusual or extreme events.
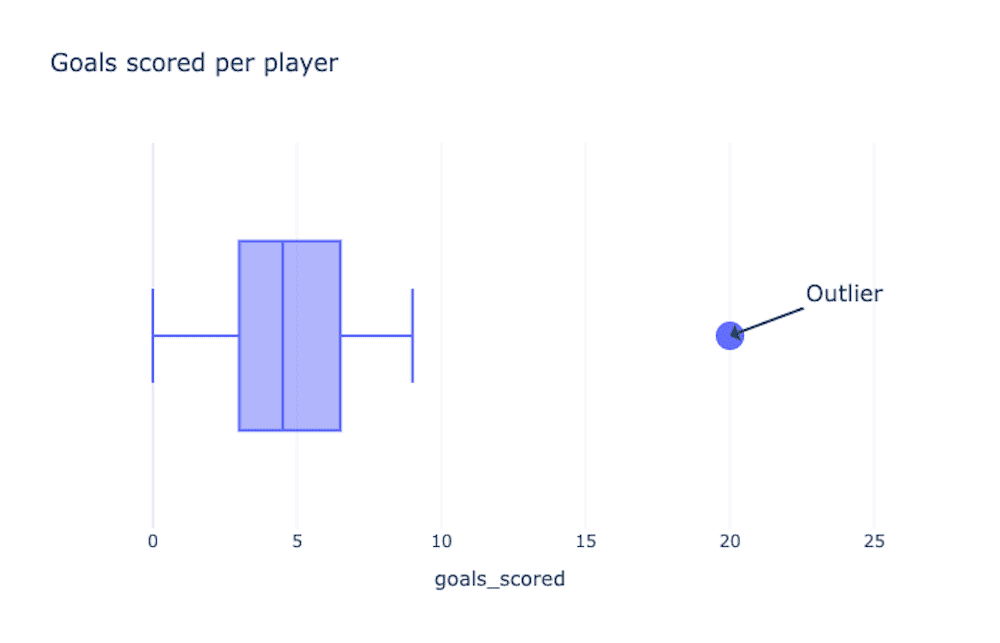
For example, if we look at the points scored by players on a team, an outlier might be a very high or very low value that is not representative of other players’ performance.
📈 Sensitive or robust to outliers? When we calculate summary statistics like the mean, median, and standard deviation, outliers can greatly impact the results. This is because these summary statistics are sensitive to extreme values. For example, if we have a dataset of test scores and there is one very low score, the mean will be pulled down towards that low score.
On the other hand, some summary statistics are more robust to outliers. This means that they are less affected by extreme values.
For example, the median is a robust measure of central tendency because it is not influenced by extreme values. The Interquartile Range (IQR) is a robust measure of spread because it is based on the middle 50% of the data and is not influenced by extreme values.
So, when we say a summary statistic is sensitive or robust to outliers, we are referring to how much of an impact outliers have on the result. Sensitive statistics are strongly influenced by outliers, while robust statistics are less affected by them.
In summary, outliers are data values that are very different from most of the other data values in a distribution. They can have a significant impact on summary statistics like the mean and standard deviation, which are sensitive to extreme values. However, other summary statistics like the median and interquartile range are more robust to outliers and are less affected by extreme values.